Undolog seems to leak memory #8302
Comments
|
Imported From: https://issues.scala-lang.org/browse/SI-8302?orig=1
|
|
@retronym said: After running In addition to: |
|
@gkossakowski said: Still, it doesn't explain what I saw about the undoLog, right? |
|
@retronym said: It never shows more than 17k entries. So its a bit of a mystery how you saw such a long path the GC root. Did it pass through Looking around through comments, it seems we are really confused as to when we can clear the log. It is cleared eagerly when we actually have something to undo (when a type relation <:< or =:= returns false). But otherwise, the comments tell us: } finally {
subsametypeRecursions -= 1
// XXX AM TODO: figure out when it is safe and needed to clear the log -- the commented approach below is too eager (it breaks #3281, #3866)
// it doesn't help to keep separate recursion counts for the three methods that now share it
// if (subsametypeRecursions == 0) undoLog.clear()
}To me, the natural place to clear the log is when we finish a type inference session. But I reckon any such attempt might run into the same underlying problem as #7782 / bce786f070afe383d203c4d809ef69803330b340, which is that we've got a single undolog per global, which is shared by interleaved typechecking that happens with source-completers. It might be interesting to see if you could move undolog to class Context {
...
/** Saved type bounds for type parameters which are narrowed in a GADT. */
var savedTypeBounds: List[(Symbol, Type)] = List() |
|
@retronym said: |
|
@gkossakowski said (edited on Feb 20, 2014 12:44:17 PM UTC): I think this does suggest we leak memory. I know that this is a transitive closure, so maybe it's not undolog that retain that object directly but indirectly through some TypeRefs. I find this to be very unlikely especially if you look at how many Tuple2 are being retained. Maybe we blow up within single compilation run when there no clearing of undolog performed? I took memory snapshot in the middle of type checking. |
|
Chua Chee Seng (cheeseng) said: |
|
@retronym said: Limiting SBT to one compilation at a time helps to reduce overall memory requirements and make the results of profiling easier to digest: sbt> set concurrentRestrictions in Global := Seq(Tags.limit(Tags.CPU, 1)) |
|
The memory leak also happens in an application using scala> :paste
// Entering paste mode (ctrl-D to finish)
import scala.reflect.runtime.{universe => ru}
println("before: " + ru.asInstanceOf[scala.reflect.runtime.JavaUniverse].undoLog.log.size)
for (_ <- 0 until 1000) {
ru.typeOf[Option[String]] <:< ru.typeOf[Option[_]]
}
println("after: " + ru.asInstanceOf[scala.reflect.runtime.JavaUniverse].undoLog.log.size)
// Exiting paste mode, now interpreting.
before: 0
after: 2000
import scala.reflect.runtime.{universe=>ru}If increasing the loop length to a large value, it will OOM. |
…ncoder

## What changes were proposed in this pull request?

Because of the memory leak issue in `scala.reflect.api.Types.TypeApi.<:<` (scala/bug#8302), creating an encoder may leak memory.

This PR adds `cleanUpReflectionObjects` to clean up these leaking objects for methods calling `scala.reflect.api.Types.TypeApi.<:<`.

## How was this patch tested?

The updated unit tests.

Author: Shixiong Zhu <zsxwing@gmail.com>

Closes #19687 from zsxwing/SPARK-19644.
…ncoder

Because of the memory leak issue in `scala.reflect.api.Types.TypeApi.<:<` (scala/bug#8302), creating an encoder may leak memory.

This PR adds `cleanUpReflectionObjects` to clean up these leaking objects for methods calling `scala.reflect.api.Types.TypeApi.<:<`.

The updated unit tests.

Author: Shixiong Zhu <zsxwing@gmail.com>

Closes apache#19687 from zsxwing/SPARK-19644.
|
Experienced the same issue. Heap dump contained lots of the following objects: Workaround suggested in apache/spark#19687 (wrapping |
scalatest has a problem with high memory consumption again:
scalatest/scalatest#235 (comment)
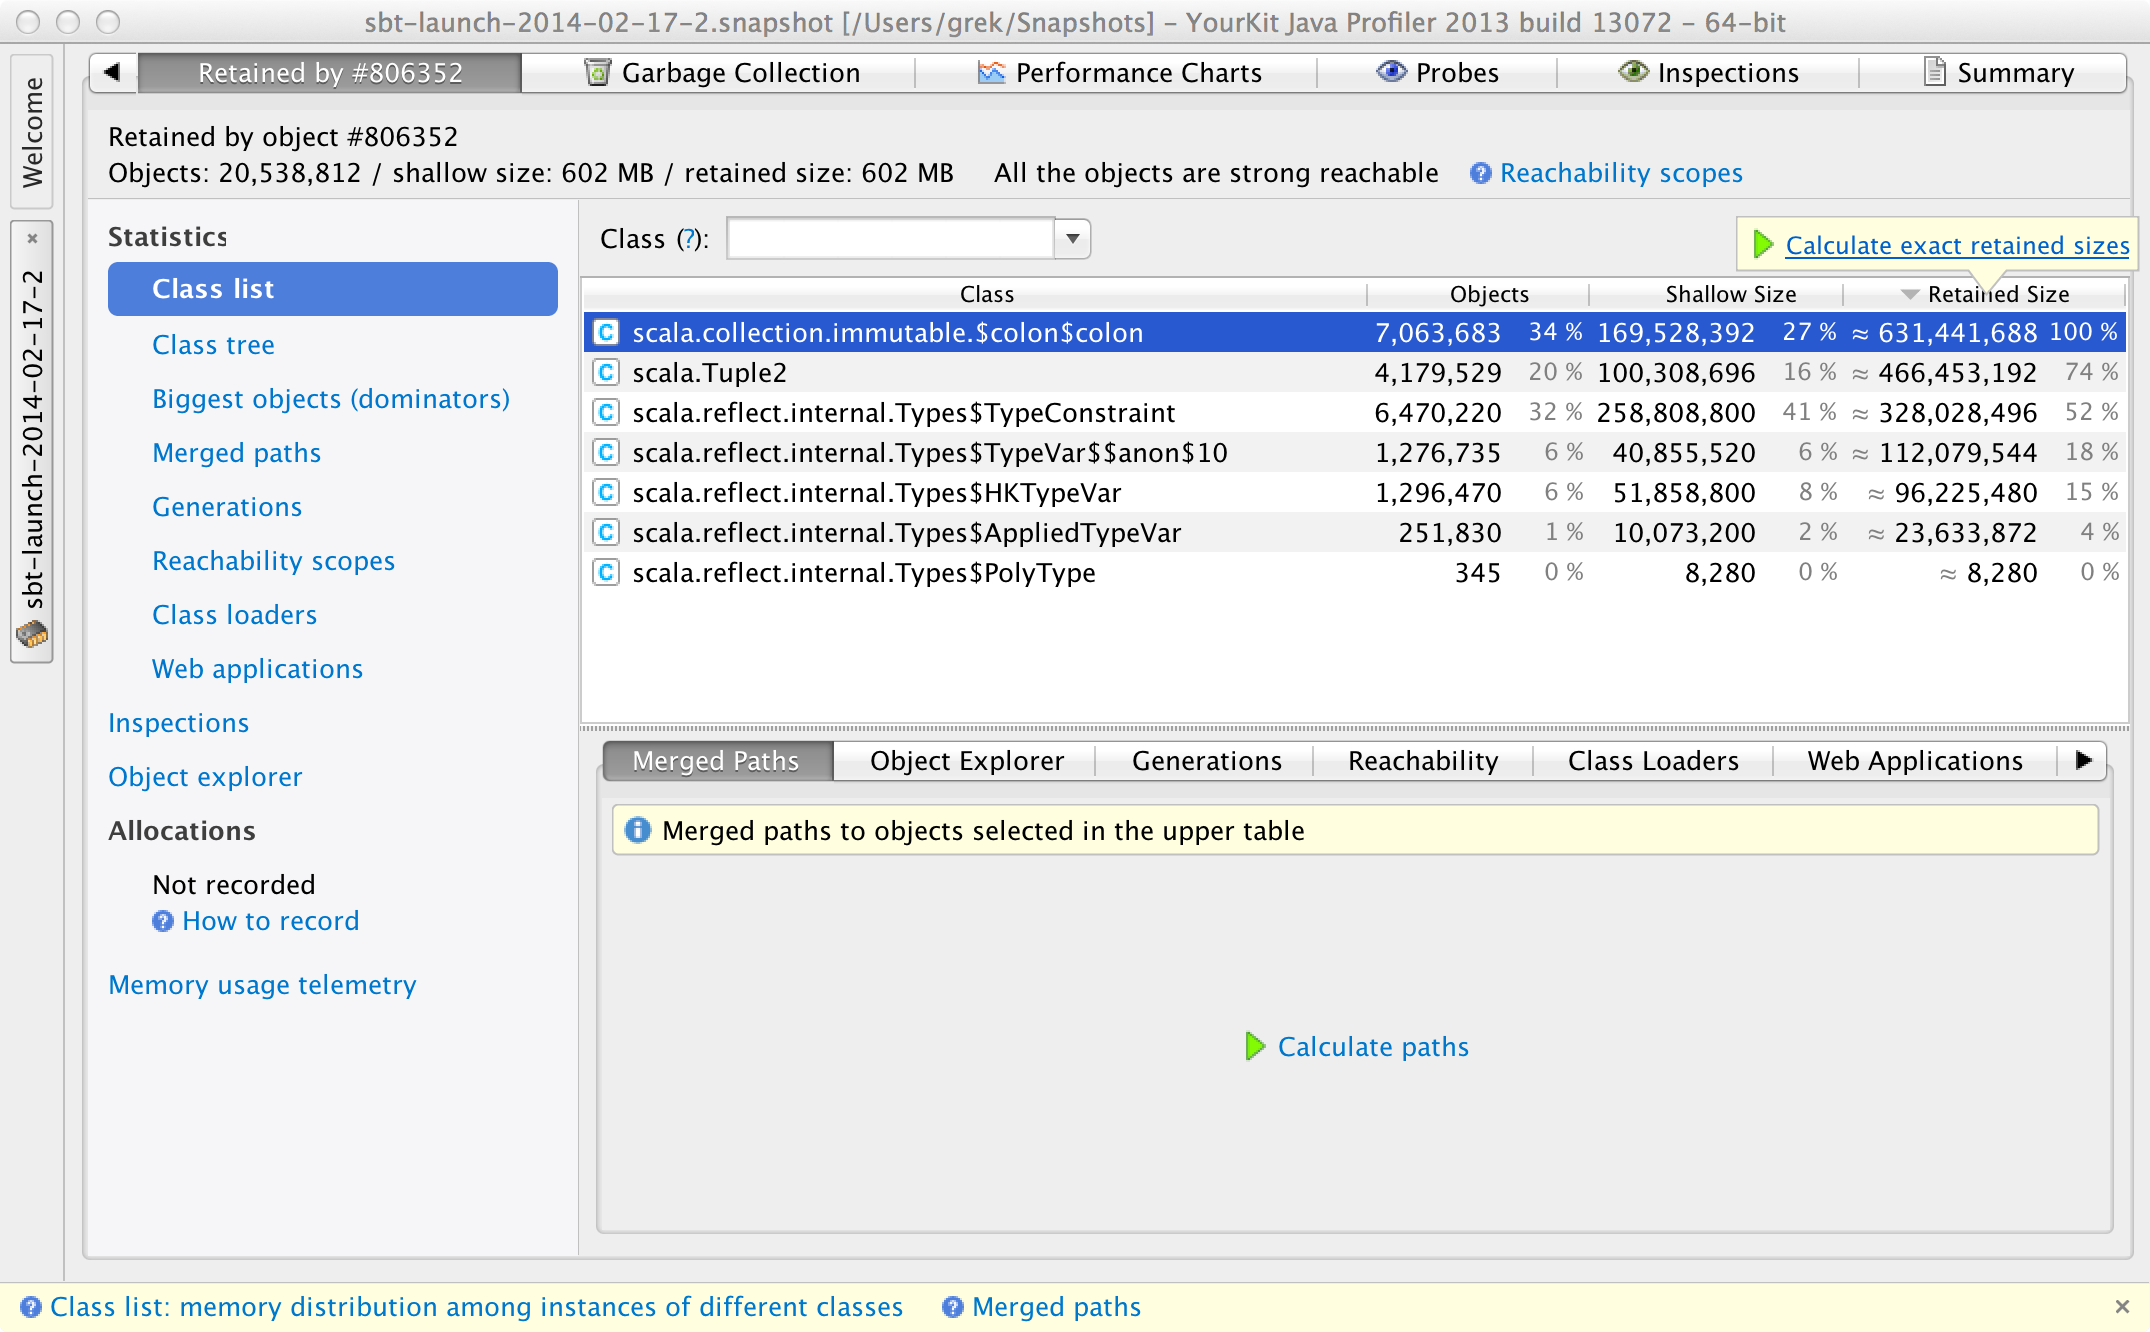
It requires about 2GB to compile its tests. I was digging into it a little bit by capturing memory snapshot at the end of typer. Yourkit suggests that we are leaking memory through
undoLog. Specifically, it shows two things:TypeConstraintand its distance from GC root is 3 897 019. That is through series of::objects that containTuple2.I can't imagine that we would go almost 4m deep in undoLog stack for any single compilation unit so it seems like we are leaking memory somehow.
Related: scala/scala#1238
The text was updated successfully, but these errors were encountered: